Plot Associations
This dialog is activated by selecting the Plot Associations... command from the Format Menu. It may also be activated by right-clicking on a plot curve and selecting Plot Associations.... This dialog is only available if the active plot layer contains data curves.
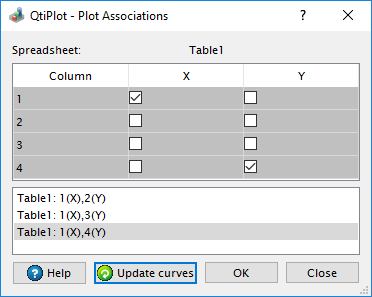
This dialog may be used to select the columns of the table to be used as X, Y and error values for the active curve.